I’ve struggled a bit with setting up Xdebug + DevKinsta in PhpStorm. So, here is my documentation and guide, which will save you a lot of time.
Note: When you see a
emoji, you need to customize a value. However, most steps are generic, and you do not need to change anything; just copy-paste what’s in this guide.
A. Create a setup script
Place the following bash script in your DevKinsta/private folder. Usually, that folder is in your user’s home directory. Name the script setup-xdebug.sh.
Example: On my machine, the script is “/Users/philipp/DevKinsta/private/setup-xdebug.sh”
We use that script to install and configure the Xdebug module on the relevant Docker container (in the next step)
#!/bin/bash

echo "=== Updating apm ==="; apt-get update

# Get a list of all present PHP versions and setup Xdebug for each of them.
update-alternatives --list php | while read bin ; do
	version=${bin#"/usr/bin/php"}
	package="php$version-xdebug"
	ini_path="/etc/php/$version/fpm/conf.d/20-xdebug.ini"

	echo; echo "=== Installing $package ==="; apt-get -y install $package
	echo "=== Prepare $ini_path ==="; cat > $ini_path <<-EOF
	zend_extension = xdebug.so
	xdebug.mode = develop,debug
	xdebug.start_with_request=yes
	xdebug.client_port=9003
	xdebug.client_host=host.docker.internal
	xdebug.log=/www/kinsta/logs/xdebug.log
EOF
done

echo; echo "All done"
B. Run the setup script
Open the terminal and run two commands:
docker exec devkinsta_fpm bash -c 'bash /www/kinsta/private/setup-xdebug.sh'
docker restart devkinsta_fpm
This will execute the script from Step 1 above on the Docker container. After that, DevKinsta can technically handle Xdebug requests!
C. Configure PhpStorm
All tasks in this step take place in the Settings dialog of PhpStorm. Below are screenshots of each task
First, make sure that you have activated the plugin “PHP Docker” in your PhpStorm settings. It’s always installed, but was initially deactivated on my machine.
- In Build, Execution, Deployment > Docker click the plus-icon to add a new Server.
Name: “Docker”
Connect to Docker daemon with: “Docker for Mac” - In PHP click the “…” button to configure your CLI Interpreters
- In the dialog click the plus-icon and add From Docker, Vagrant, VM, WSL, Remote, …
- Configure the remote interpreter
Type: Docker
Server: Docker (the one you created in task 1 above)
Image name: “kinsta/devkinsta_fpm:0.1.3”
That’s it. Save the CLI interpreter - Edit the path mappings of the new CLI interpreter
- Add a new path mapping that points to your DevKinsta/public folder:
Local Path: “/Users/{user}/DevKinsta/public” insert your custom path here!
Remote Path: “/www/kinsta/public” (do not change this, it’s always the same)
All done. Close the path mappings settings - Add a new include path to tell PhpStorm where your WP project is located
- The new Include path should point to the web-root of your DevKinsta website
Path: “/Users/{user}/DevKinsta/public/{website}” insert your custom path here!
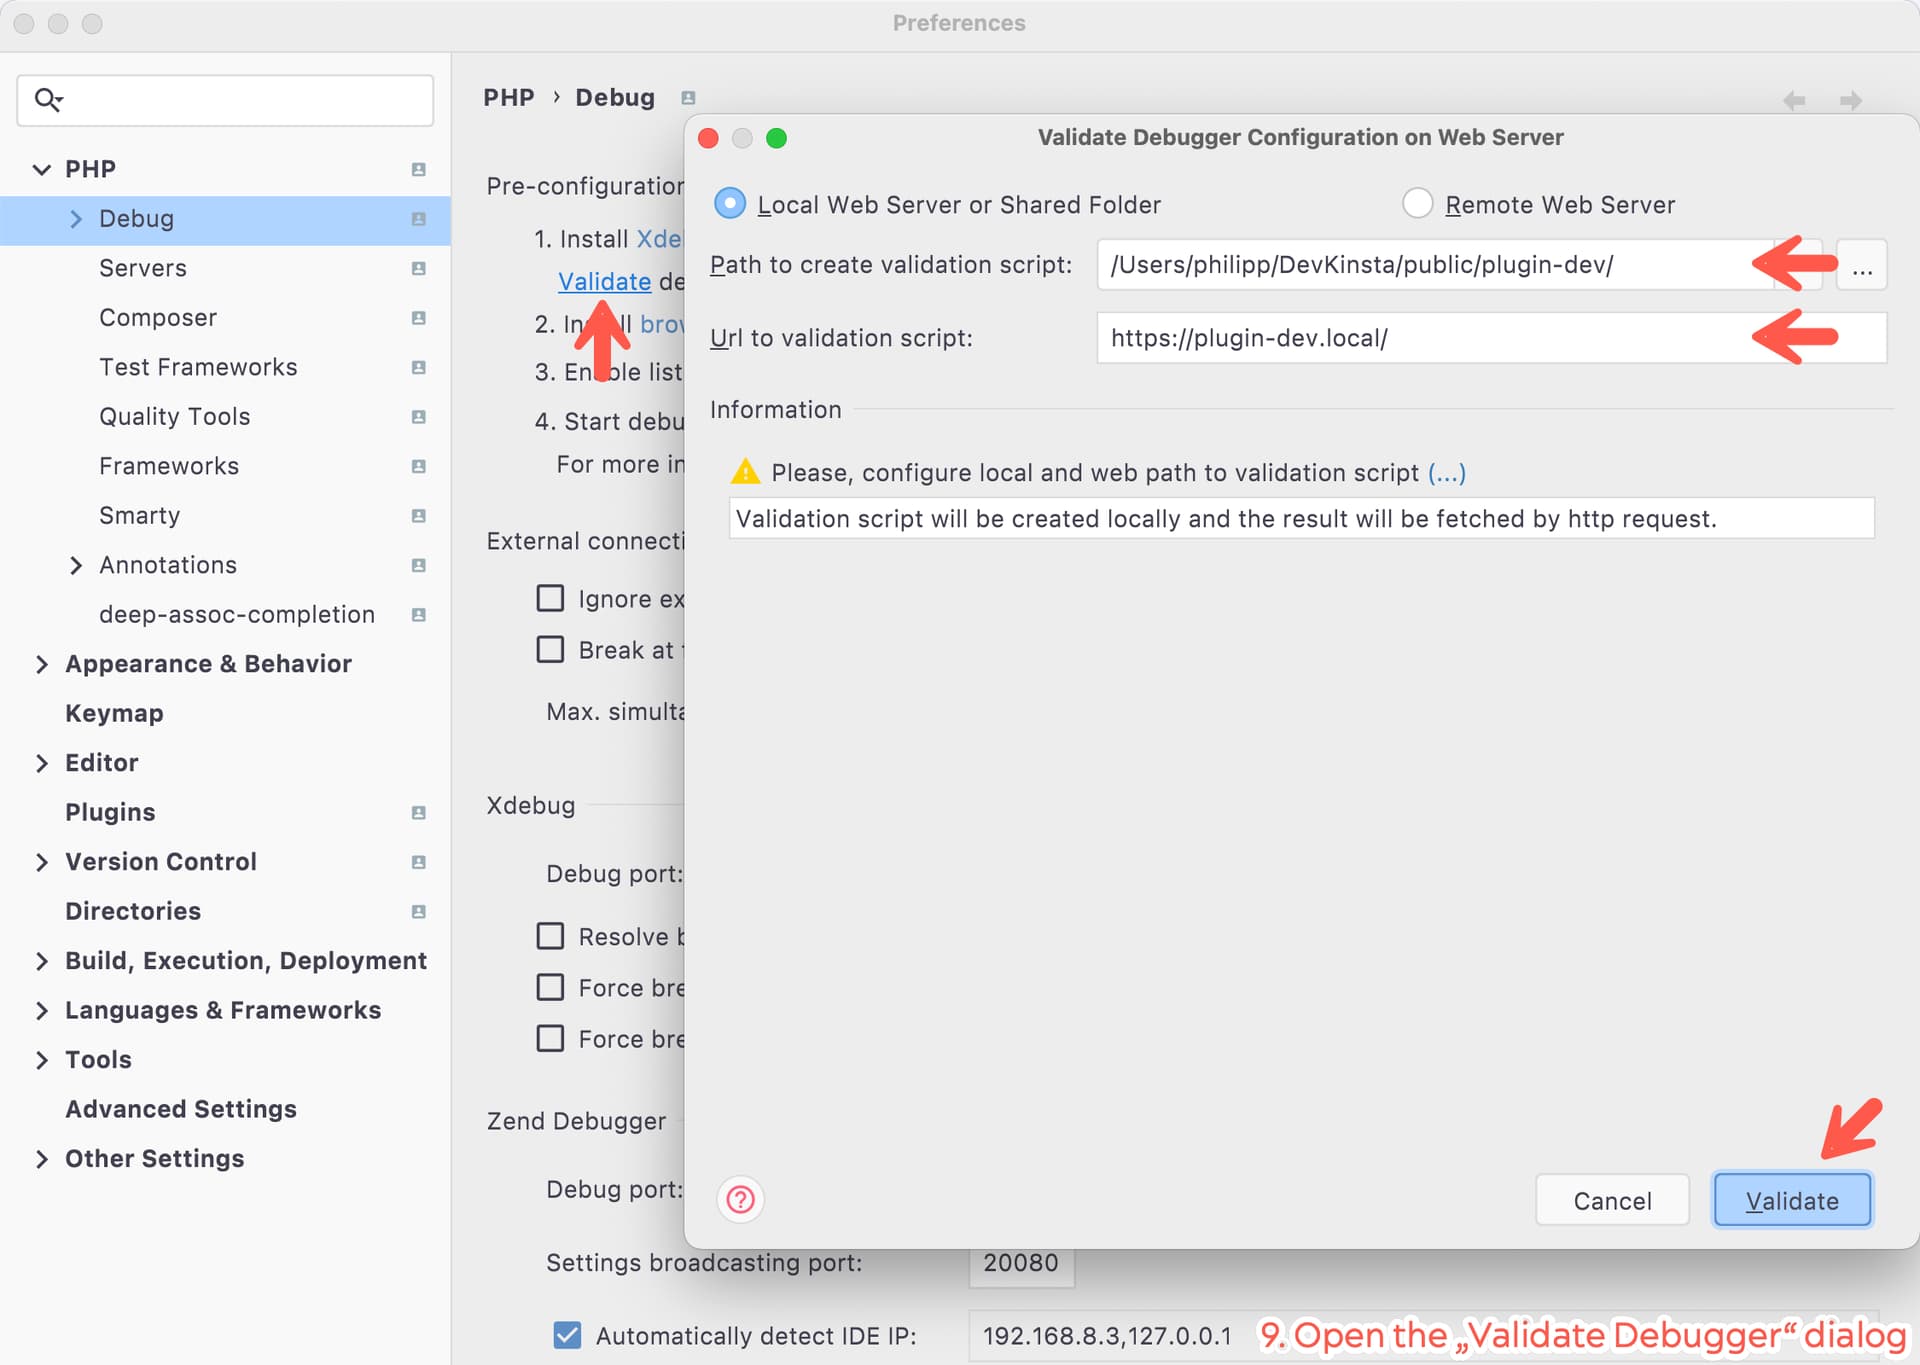
Example: “/Users/philipp/DevKinsta/public/plugin-dev” - Navigate to PHP > Debugger and click on the “Validate” link to see, if everything is working!
Path to validation script: “/Users/{user}/DevKinsta/public/{website}” same as in task 8 above
URL to validation script: “https://{website}.local” enter the URL of your DevKinsta website
Click the “Validate” button - Within 1-2 seconds you should see a list of green checks which indicate that everything is okay.
- Finally, check your Debug settings. Important settings:
Debug Port: Must include “9003”
Enable “Can accept external communications”
That’s it! You can use the built-in Step-Debugger of PhpStorm with your DevKinsta website.
D) DevKinsta Updates
When DevKinsta updates the Docker container, it can happen, that the Xdebug module is deleted again from your container. If that ever happens, you only need to run the two commands from Step B again, which are:
docker exec devkinsta_fpm bash -c 'bash /www/kinsta/private/setup-xdebug.sh'
docker restart devkinsta_fpm
This will re-install Xdebug on the updated container. Everything else will work after that; just to be certain, you should also use the PhpStorm “Validate Debugger” dialog (task C.9 above)
Screenshots of Step C (PhpStorm configuration)
Task 1:

Task 2:

Task 3:

Task 4:

Task 5:

Task 6:

Task 7:

Task 8:

Task 9:
Task 10:

Task 11:
